In this article, I explain what is a scalable vector graphic (SVG) and how it differs from other graphics. I will also walk you through coding your very first graphic!
A Primer on Computer Graphics
A computer graphic is either a bitmap graphic or a vector graphic.
Instead of boring you with the technical details to start, let’s explain the difference between these graphics with a visual experiment…
Bitmap Graphics
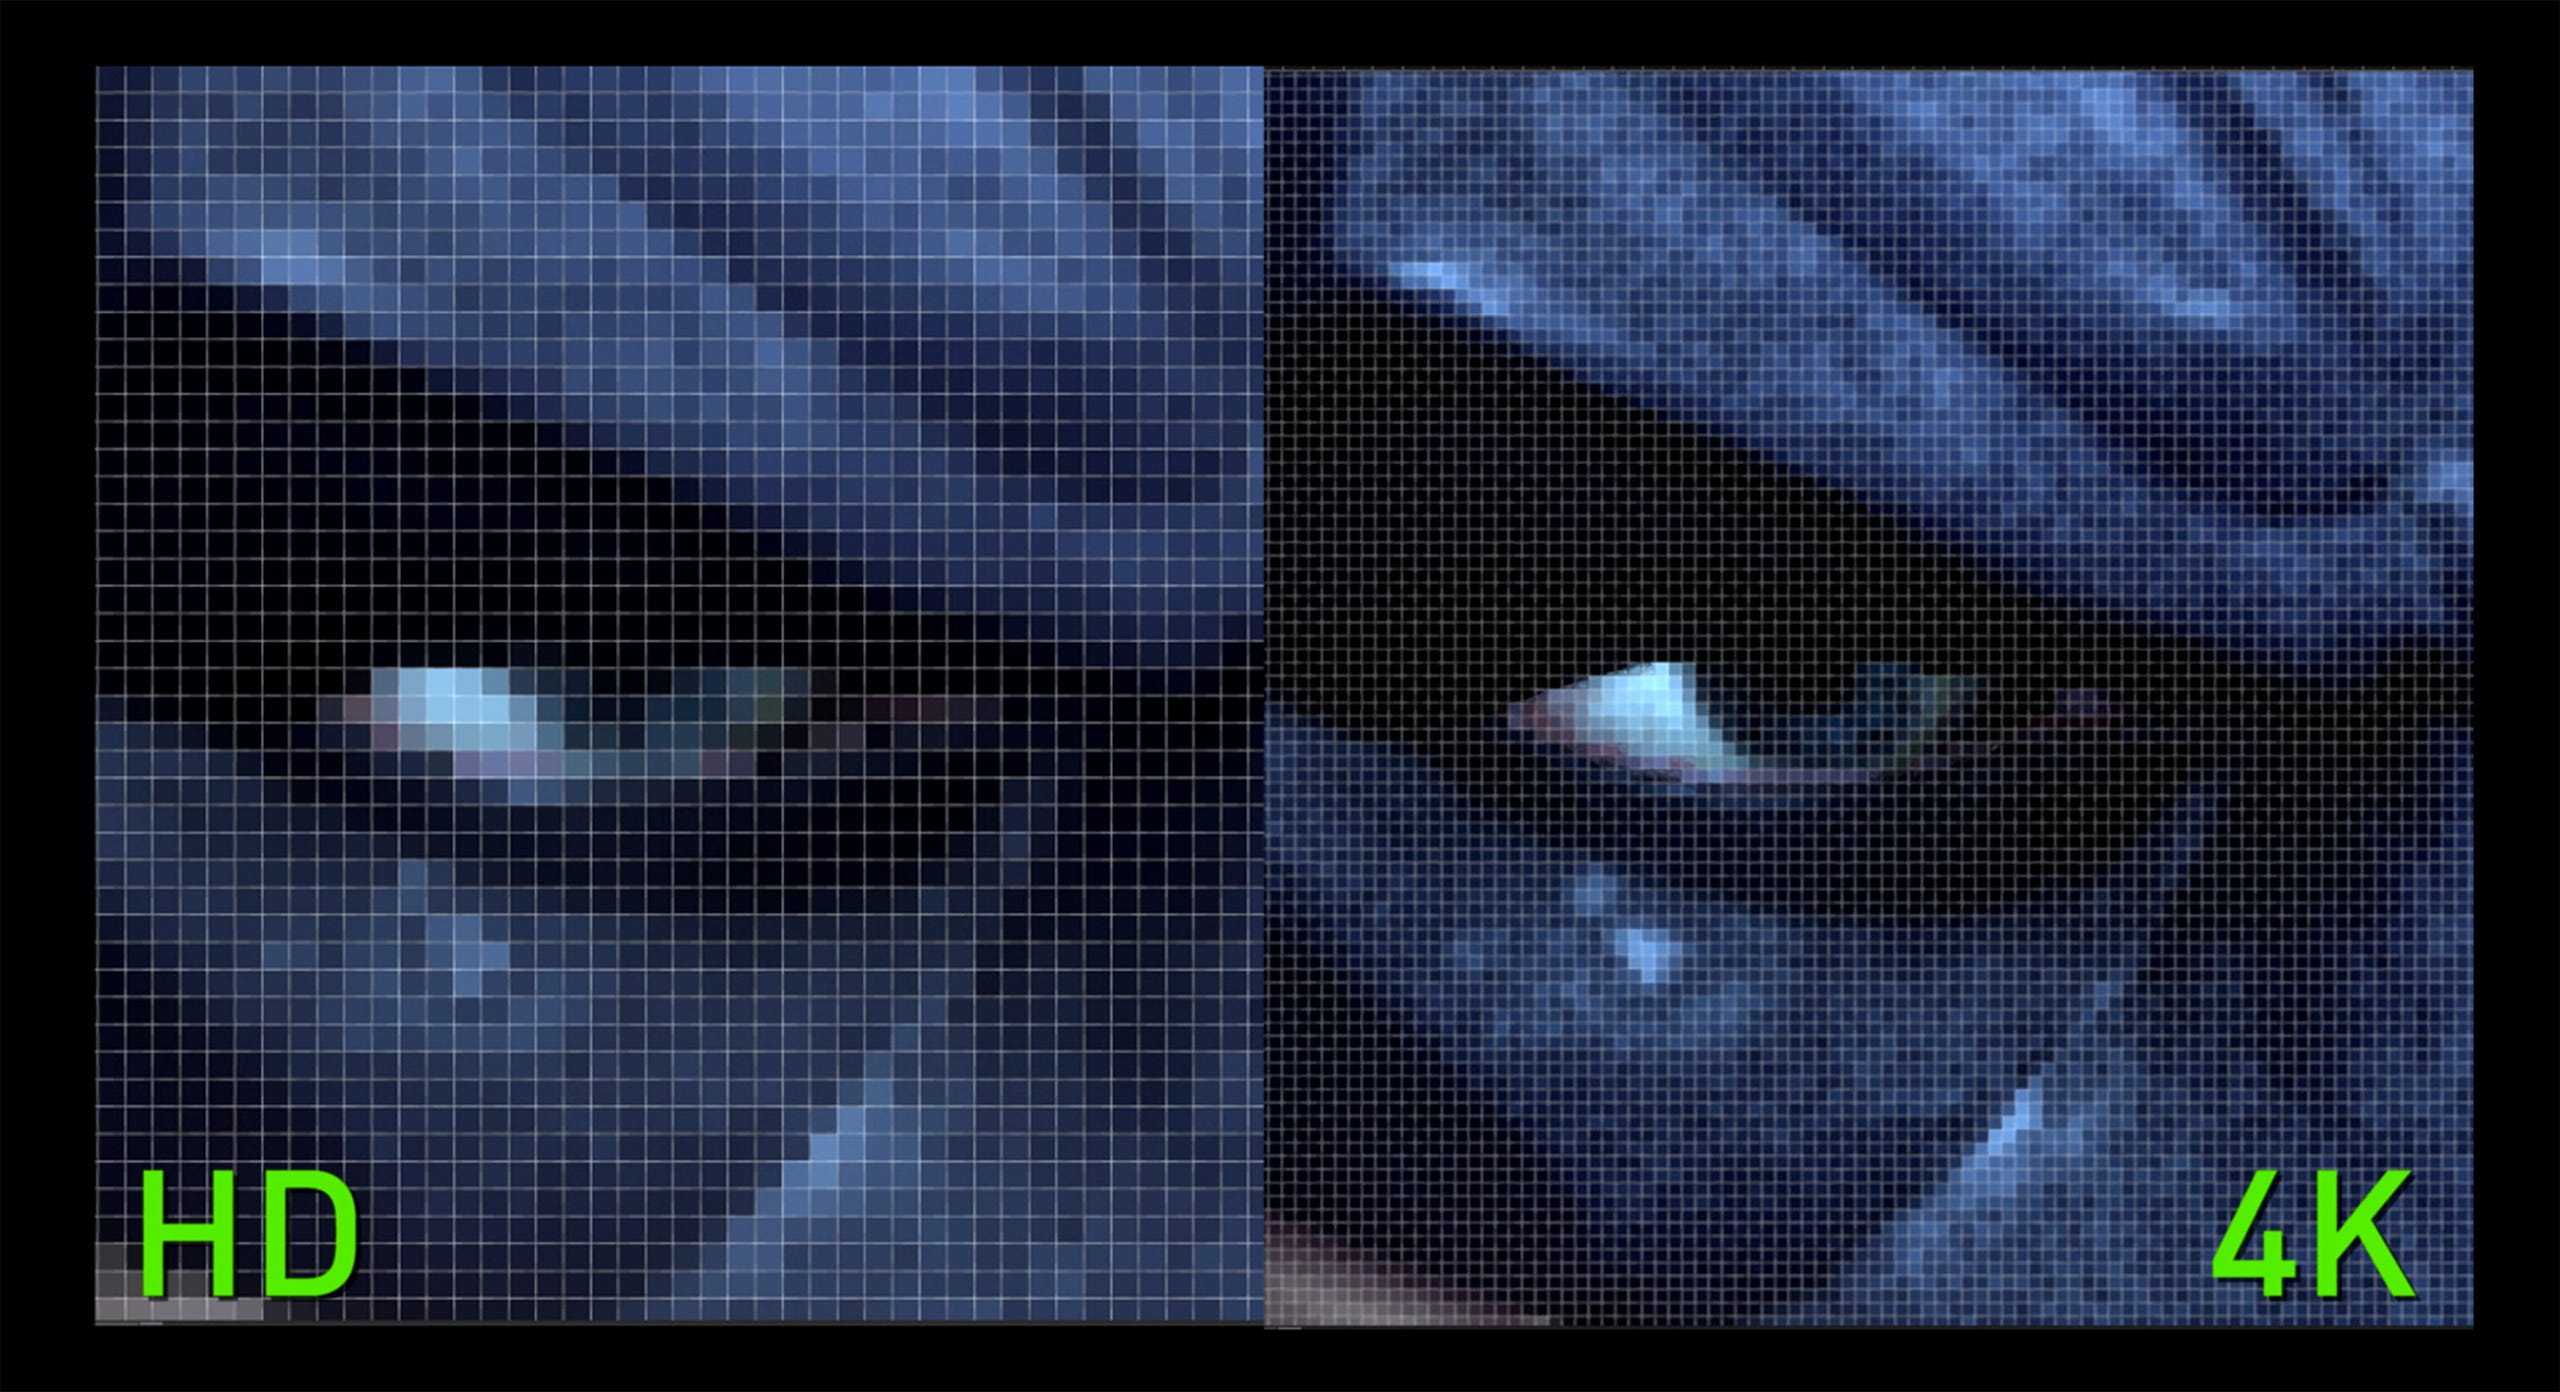
Save a screenshot of your current screen. Then, open it up.
If you zoom in far enough, you’ll notice that it now looks pixelated:

The zoomed in graphic looks pixelated because it is composed of individual, square boxes, each containing a unique color.
Most of us are likely accustom to that exact word, pixelated. This word actually has a technical origin.
Pixels is the condensed word for picture elements.
Those colored square boxes in the zoomed in graphic are the picture elements, or pixels for short.
In short, a bitmap graphic is a graphic composed of pixels.
Makes sense, but where does the word bitmap come from?
Each pixel has a unique color. The unique color is expressed in bits. Therefore…
Bitmap (bit-map) refers to the number of bits within the mapped pixels in a graphic.
Hence, a pixelated graphic is called a bitmap graphic.
Cool, but wait, why do I see the pixels when I zoom in?
A visual display has a limit to how many pixels can be displayed, defined by the resolution. However, there is no limit to the amount of pixels that can make up a bitmap graphic.
Resolution of a device determines the visual quality of a rendered bitmap graphic.
A better resolution can handle more pixels, meaning there will be a higher concentration of colored squares. The higher a concentration of colored squares results in a clearer graphic.
Additional Notes:
- Sometimes also called raster graphics
- Common file types are:
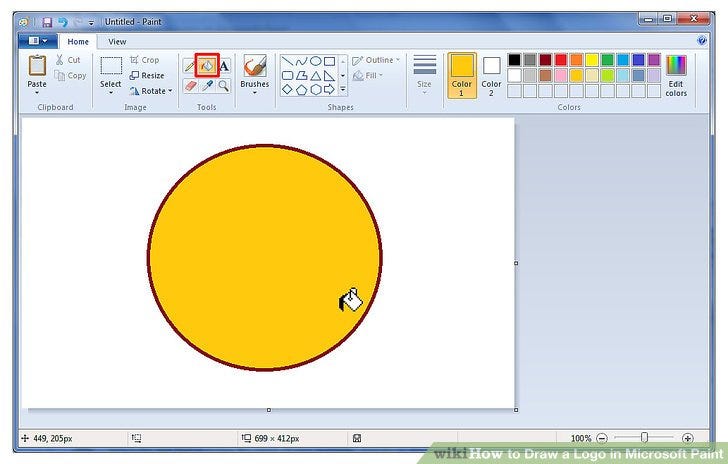
.png,.jpg,.jpeg - Applications that work with this type of graphic include:
Gimp,Paint,Photoshop
Vector Graphics
There is one key difference to keep in mind between bitmap graphics and vector graphics.
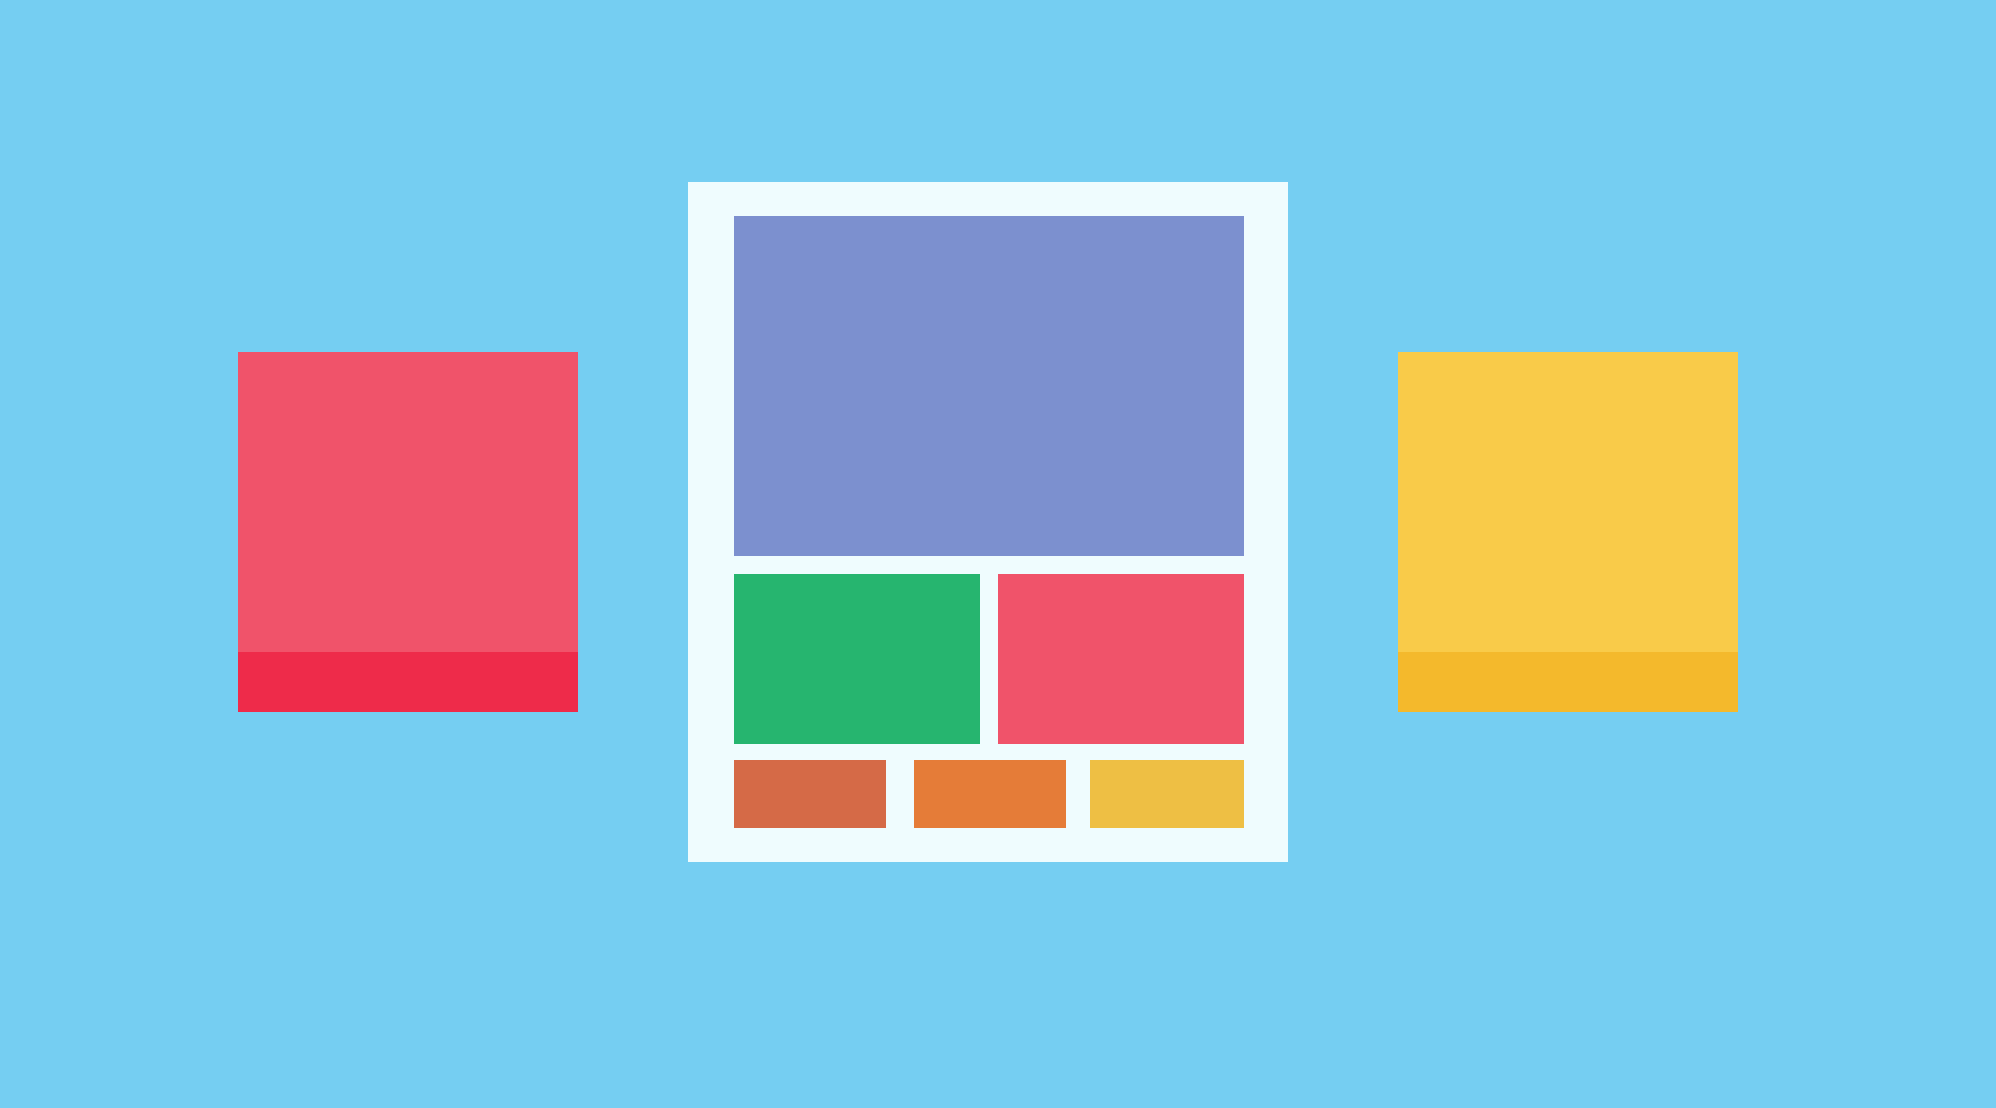
Whereas bitmap graphics the building blocks are individual square boxes (aka picture elements aka pixels), the building blocks of vector graphics are individual shapes.
At a low-level, bitmap and vector graphics are generated using “instructions”.
Generating a bitmap graphic, therefore, requires instructions to create a mapping of pixels with each pixel containing a certain amount of bits.
Generating a vector graphic, on the other hand, requires instructions to create an arrangement of shapes.
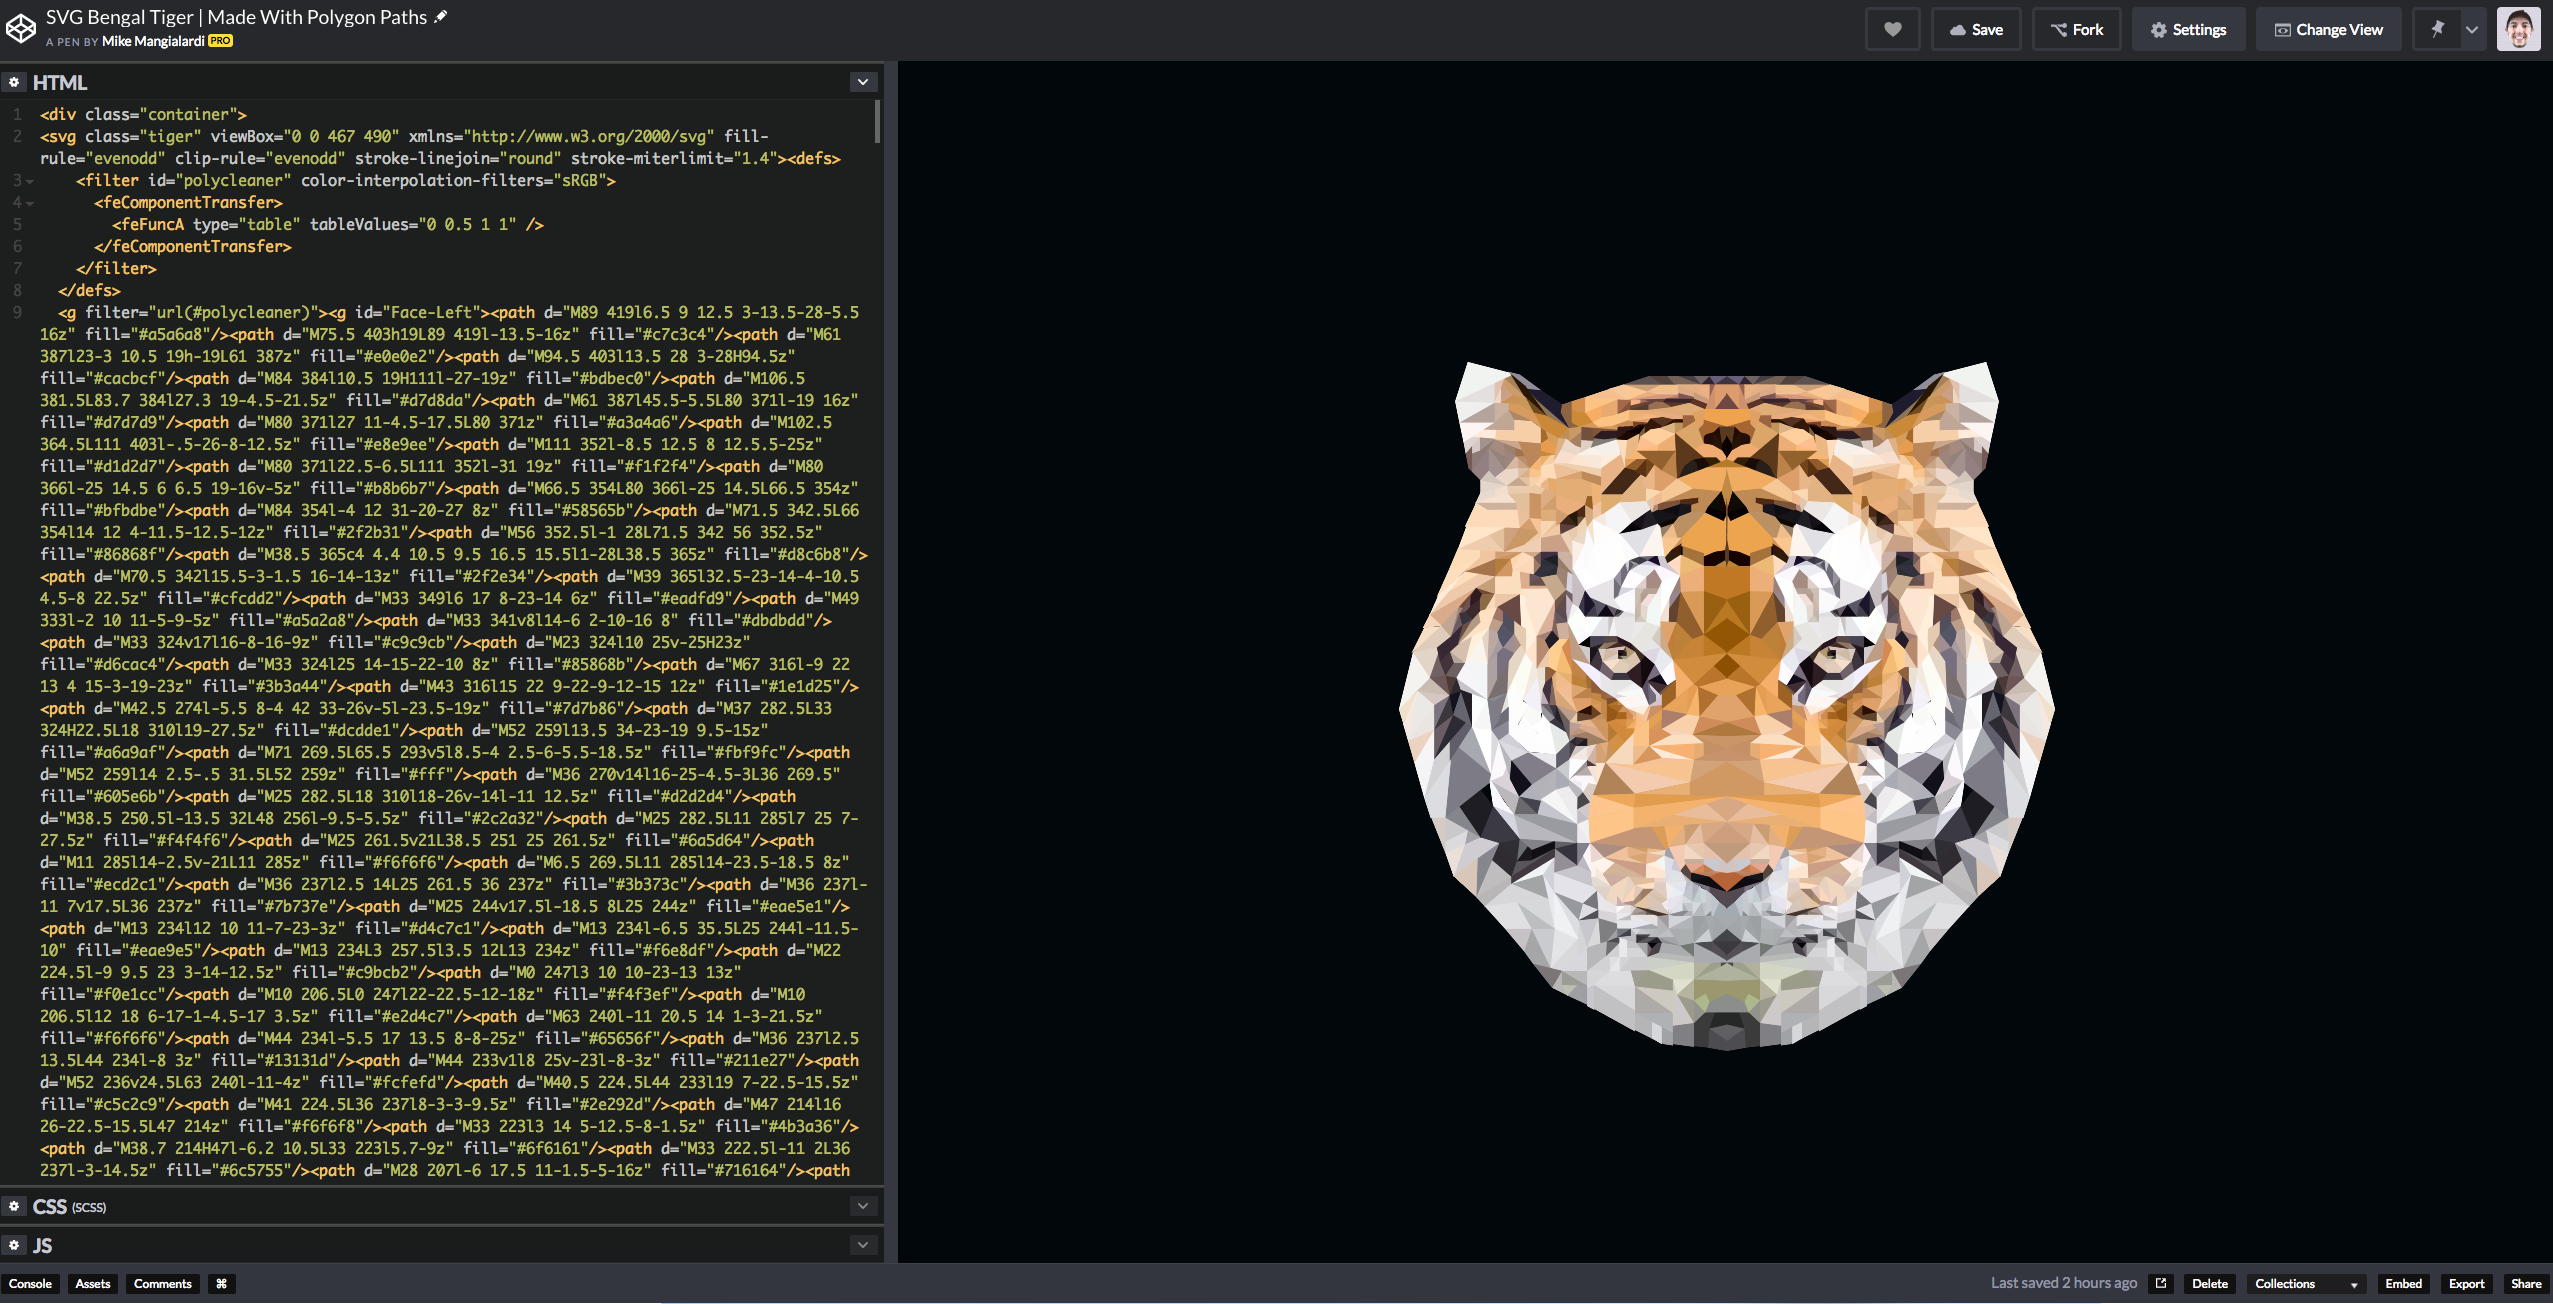
These shapes can be mathematically calculated to render on any resolution.
Vector graphics can, therefore, be scaled without losing quality.
You can try this out by opening the Google vector graphic in a new tab. Zoom in via the browser, not by taking a screenshot (generated screenshots are bitmap graphics).

In the image above, I am zoomed in and notice there are no square boxes. The image looks crisp and scaled without losing quality.
Additional Notes:
- Common file type is
.svg(will explain next 🙂) - Applications that work with this type of graphic include:
Adobe Illustrator,Sketch,Figma,Affinity Designer - There are several benefits, but at this point, the only one to note is that they can work on any scale/resolution and always look clean and crisp.
Scalable Vector Graphics (SVGs)
I have not found (nor been able to create) a better explanation of SVGs than the following:
Scalable Vector Graphics (SVG) is an XML-based markup language for describing two dimensional based vector graphics. SVG is essentially to graphics what HTML is to text. — MDN Web Docs
HTML says “here are some instructions on how to generate this text” and SVG says “here are some instructions on how to create shapes to generate this graphic.”
SVGs are meant to be used on the web. They can be sprinkled alongside your HTML on any web application.
The Markup
I think the easiest way to learn the markup is by writing it out. Let’s create the following graphic together:

I’ll be using Codepen to create this graphic.
Make sure to select “SCSS” as the CSS preprocessor.
First things first, we can style the body (already implicit in Codepen markup):
body {
  display: flex;
  justify-content: center;
  align-items: center;
  height: 100vh;
  background-color: #25A9FC;
}
The height and background-color properties should be straight-forward. display: flex , justify-content: center , and align-items: center are flexbox rules.
<svg>
The outermost element of a SVG is the svg element:
<svg>
</svg>
This element serves as the container for our graphic that will render within the web page.
There are two attributes that we need to add to this element. The first is xlmns with a value of "http://www.w3.org/2000/svg".
<svg xmlns="[http://www.w3.org/2000/svg](http://www.w3.org/2000/svg)">
</svg>
This says “this tag and all of its child tags use the XML dialect as defined at http://www.w3.org/2000/svg". You can read up here if you are curious about more details, but this is an attribute you will always have to add to the outermost svg element.
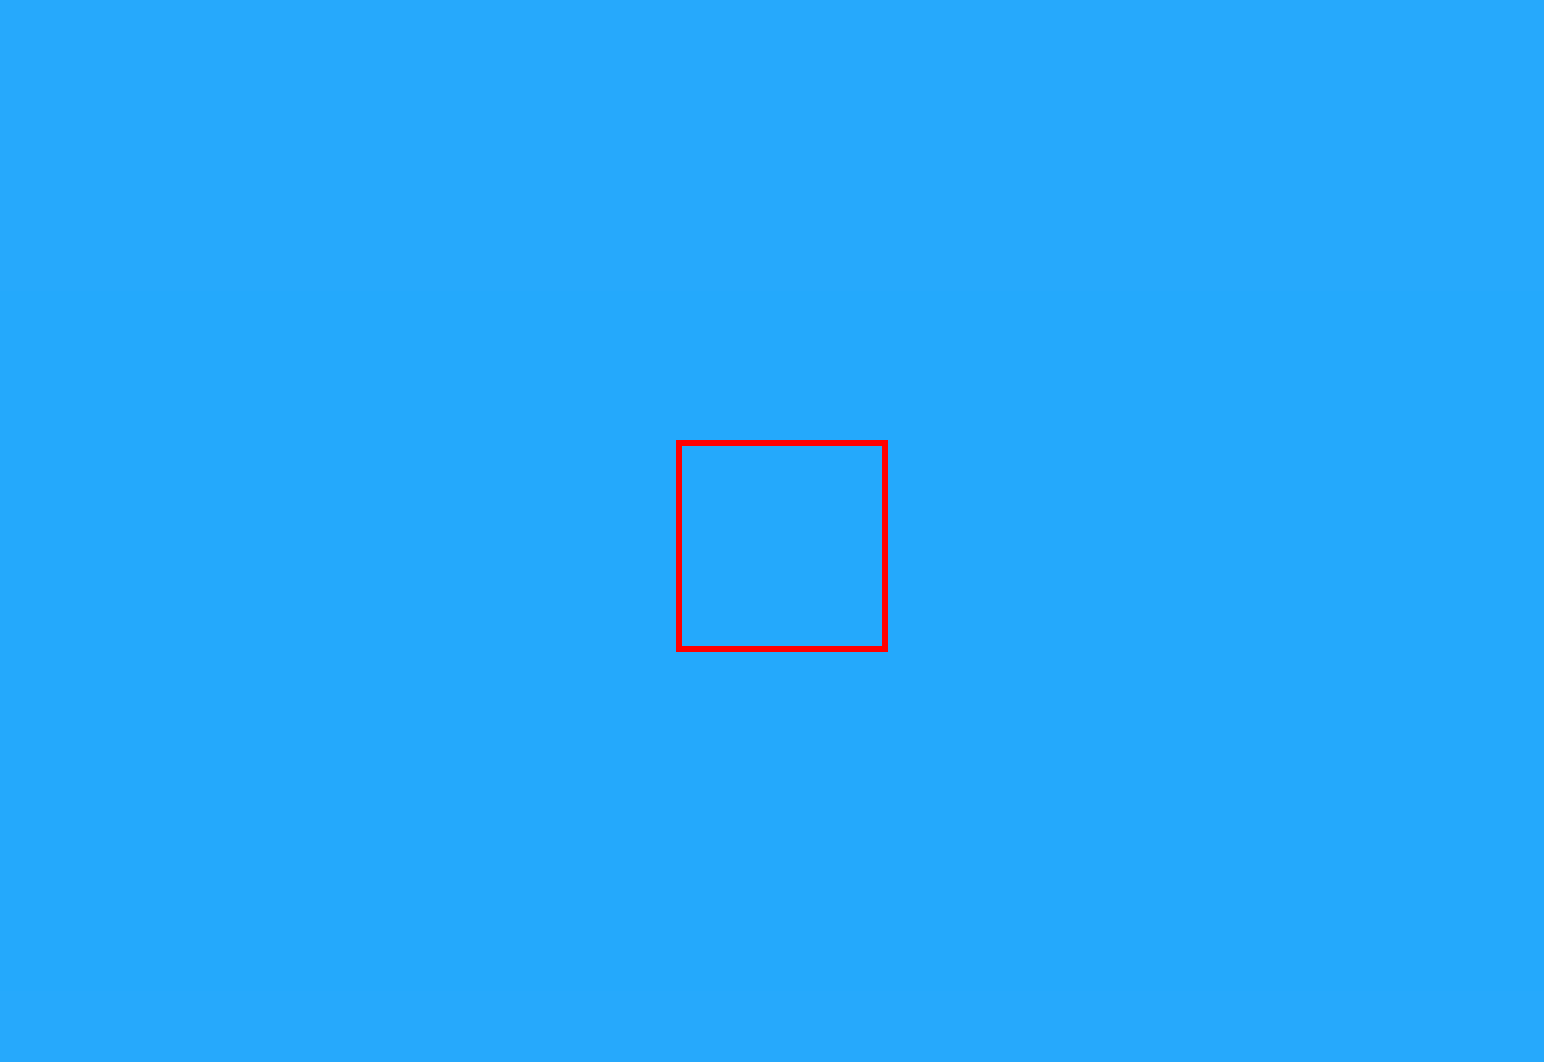
The second attribute is viewBox. The viewbox attribute has four numbers that create a coordinate system. You can think of this as creating the area where we will “draw” the graphic.
<svg
  viewBox="0 0 100 100"
  xmlns="[http://www.w3.org/2000/svg](http://www.w3.org/2000/svg)"
\>
</svg>
The first two numbers define the x and y origin of the coordinate system. For an introduction, and most use cases, we just want to work with a coordinate system with an origin a 0,0 (like we are used to working with in math class).
The final two numbers define the width and height of our coordinate system. You’ll notice there are no units (like 100px 100px). We can define this with the height and width properties in our CSS (alternatively, we could define them as additional attributes on the tag):
body {
  display: flex;
  justify-content: center;
  align-items: center;
  height: 100vh;
  background-color: #25A9FC;
}
svg {
  height: 100px;
  width: 100px;
  border: solid 3px red; // so we can see the area
}
<circle>
We now have our area where we can right some more markup that will draw our graphic.
As previously mentioned, SVGs are graphics created using individual shapes.
There are six tags that we could use to create some basic shapes:
<circle />
<rect />
<ellipse />
<line />
<polyline />
<polygon />
Obviously, more complex shapes can’t always be defined so neatly, causing you need to need more precise control. There where the path tag comes in, which you can think of as a custom, free-form definition of a shape.
You could look up documentation for the attributes that go along with each shape to experiment. For this tutorial, we will just work with the circle tag:
<svg
  viewBox="0 0 100 100"
  xmlns="[http://www.w3.org/2000/svg](http://www.w3.org/2000/svg)"
\>
  <circle>
  </circle>
</svg>
There are three attributes specific to circle that will define the size and position.
cx and cy will define the center of the circle’s x and y position for the relative to the drawing area we’ve created:
<svg
  viewBox="0 0 100 100"
  xmlns="[http://www.w3.org/2000/svg](http://www.w3.org/2000/svg)"
\>
  <circle cx="50%" cy="50%">
  </circle>
</svg>
By using 50%, we are saying that we want the center of our circle to be dead center.
Relative to our coordinate system, it will be 50px from the left horizontal point out of the total 100px area and 50px from the top vertical point out of the total 100px area.
We have our positioning set, but we won’t be able to see our circle until we define a size.
In order to create size for a circle, we define the radius which is represented in the r attribute:
<svg
  viewBox="0 0 100 100"
  xmlns="[http://www.w3.org/2000/svg](http://www.w3.org/2000/svg)"
\>
  <circle cx="50%" cy="50%" r=25%>
  </circle>
</svg>
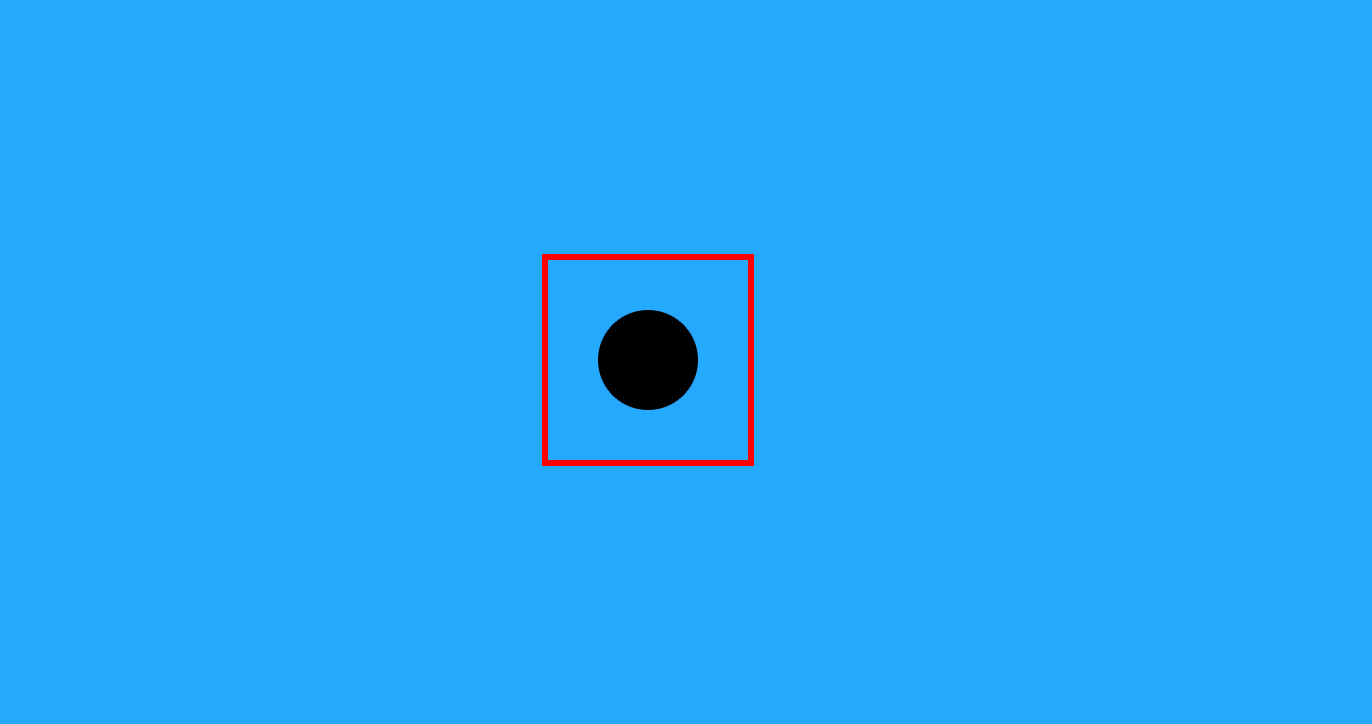
That’s it! We’ve created our first SVG shape.
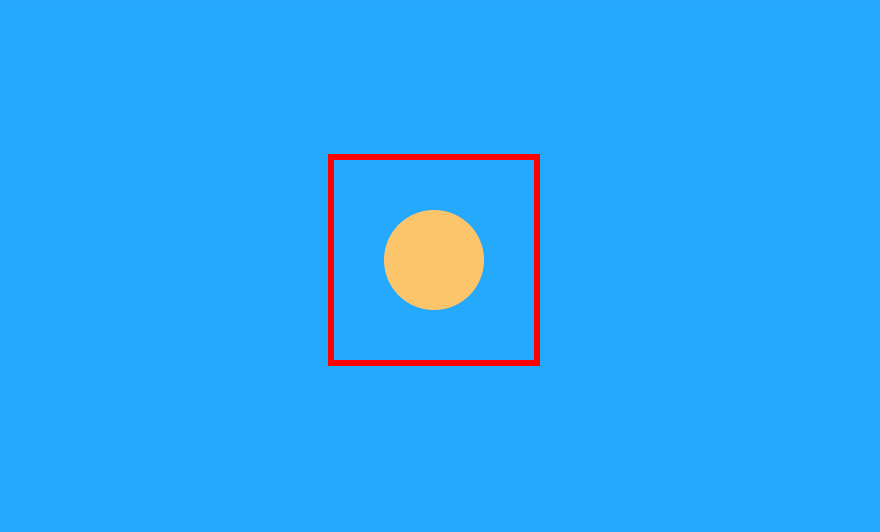
Now, there are some other SVG attributes (not specific to a circle) that we can apply to style this.
As a personal rule, I like to define attributes not particular to a certain tag via CSS rules:
body {
  display: flex;
  justify-content: center;
  align-items: center;
  height: 100vh;
  background-color: #25A9FC;
}
svg {
  height: 100px;
  width: 100px;
  border: solid 3px red;
}
circle {
  fill: white;
}
fill defines the color of the shape. You can think of it as the “bucket” for SVGs.
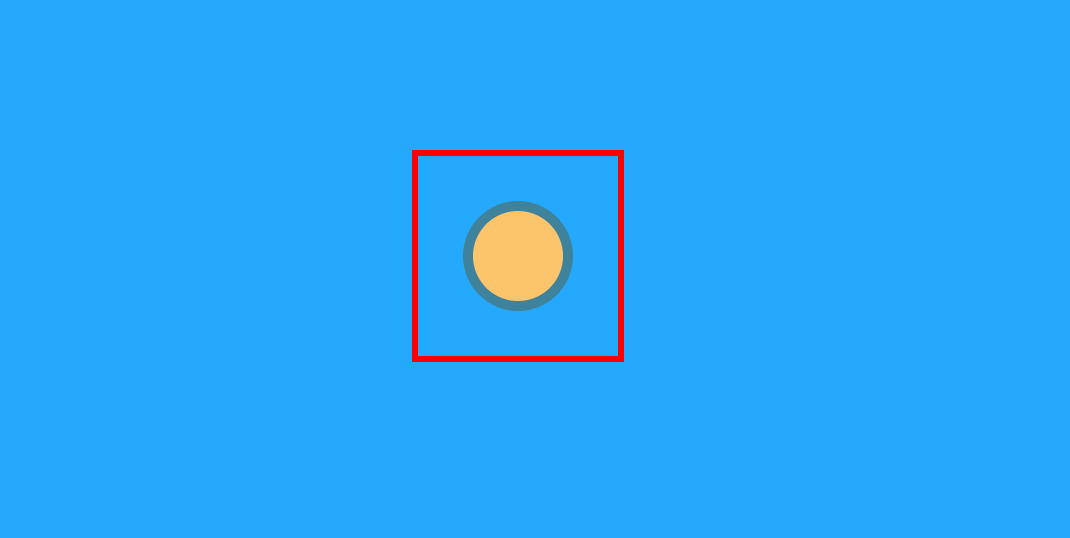
Next, we can use stroke to define the border:
body {
  display: flex;
  justify-content: center;
  align-items: center;
  height: 100vh;
  background-color: #25A9FC;
}
svg {
  height: 100px;
  width: 100px;
  border: solid 3px red; // so we can see the area
}
circle {
  fill: #FDC56B;
  stroke: #3E829B;
}
Just like there is border-width in CSS, we can use stroke-width to make this thicker and easier to see.:
body {
  display: flex;
  justify-content: center;
  align-items: center;
  height: 100vh;
  background-color: #25A9FC;
}
svg {
  height: 100px;
  width: 100px;
  border: solid 3px red; // so we can see the area
}
circle {
  fill: #FDC56B;
  stroke: #3E829B;
  stroke-width: 5;
}
Lastly, we can add a smaller circle element within our drawing area to complete our ball:
<svg
  viewBox="0 0 100 100"
  xmlns="[http://www.w3.org/2000/svg](http://www.w3.org/2000/svg)"
\>
  <circle cx="50%" cy="50%" r=25% />
  <circle cx="50%" cy="50%" r=10% />
</svg>
…and finally, we style it:
body {
  display: flex;
  justify-content: center;
  align-items: center;
  height: 100vh;
  background-color: #25A9FC;
}
svg {
  height: 100px;
  width: 100px;
  border: solid 3px red; // so we can see the area
}
circle {
  &:first-child {
    fill: #FDC56B;
    stroke: #3E829B;
    stroke-width: 5;
  }

  &:last-child {
    fill: #D45F5B;
  }
}
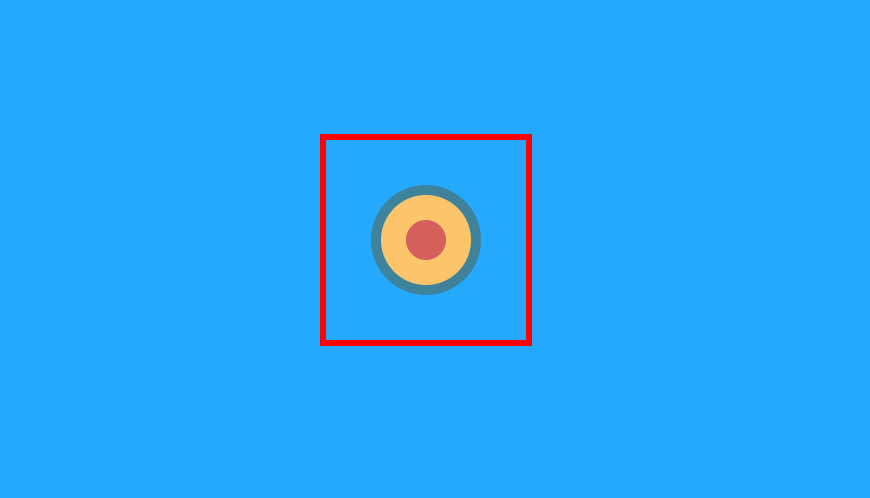
To wrap up, I will remove the border, increase the height and width of our drawing area, and bump up the stroke-width of the outer circle.
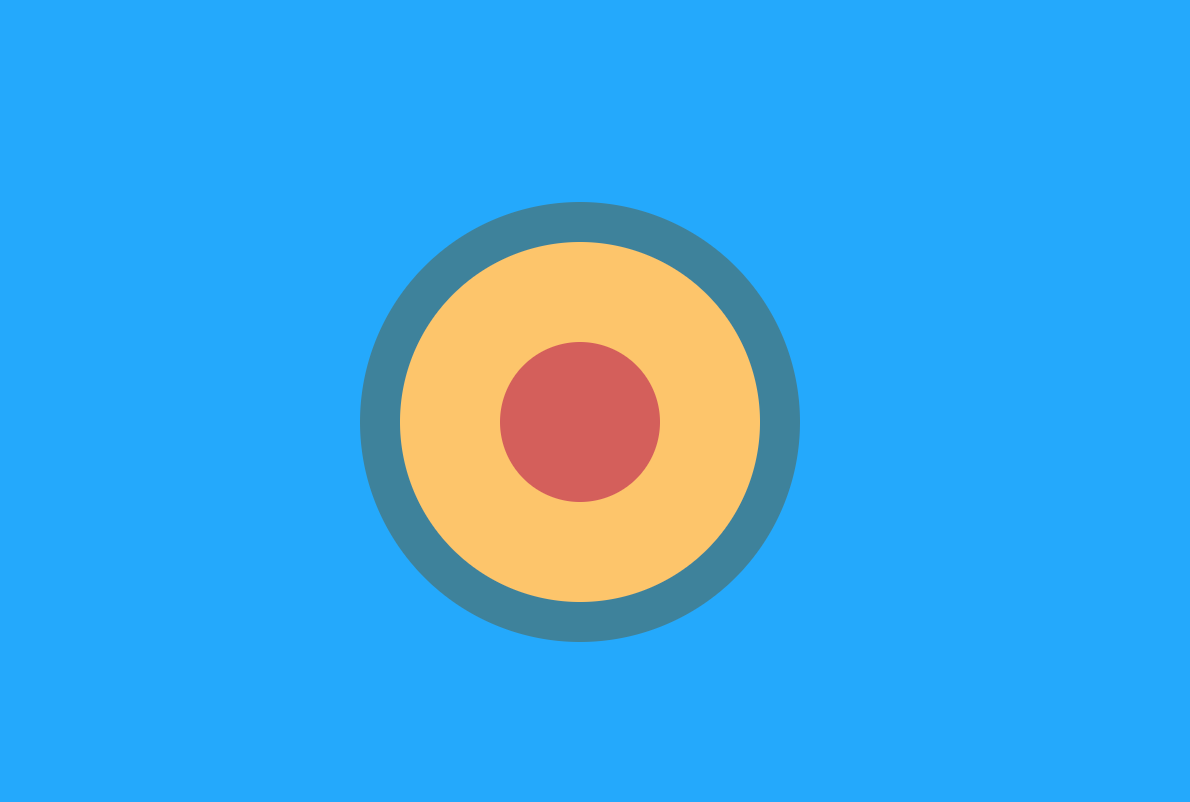
You can view the final code here! 🚀
Conclusion
We’ve explained what are scalable vector graphics as opposed to bitmap graphics and dabbled in creating a simple graphic.
In the next part of the series, I will be covering basic SVG animations.
Pow, discuss, and share! 😃

